Charleston vs. Savannah: Financial Reality
FY2016–FY2025: operating cash, container volumes, lobbying activity, and the timing of state support TEUs in millions $000s where shown
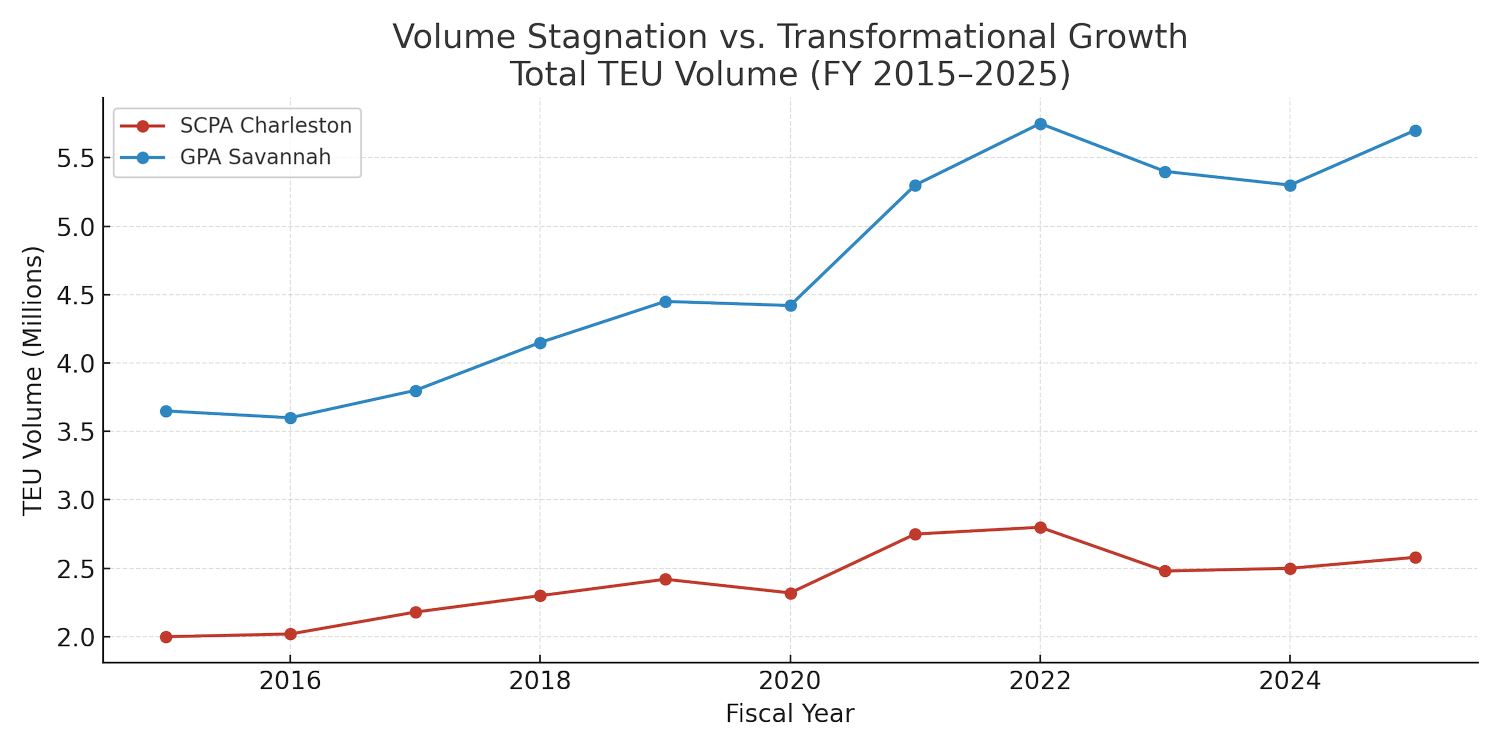
Volume Reality: Flat Growth in the Years That Matter
Operating Cash: Internal Capacity to Self-Fund
“Operating cash” below refers to Net cash provided by operating activities from audited Statements of Cash Flows — a direct signal of internally generated capacity available for reinvestment.
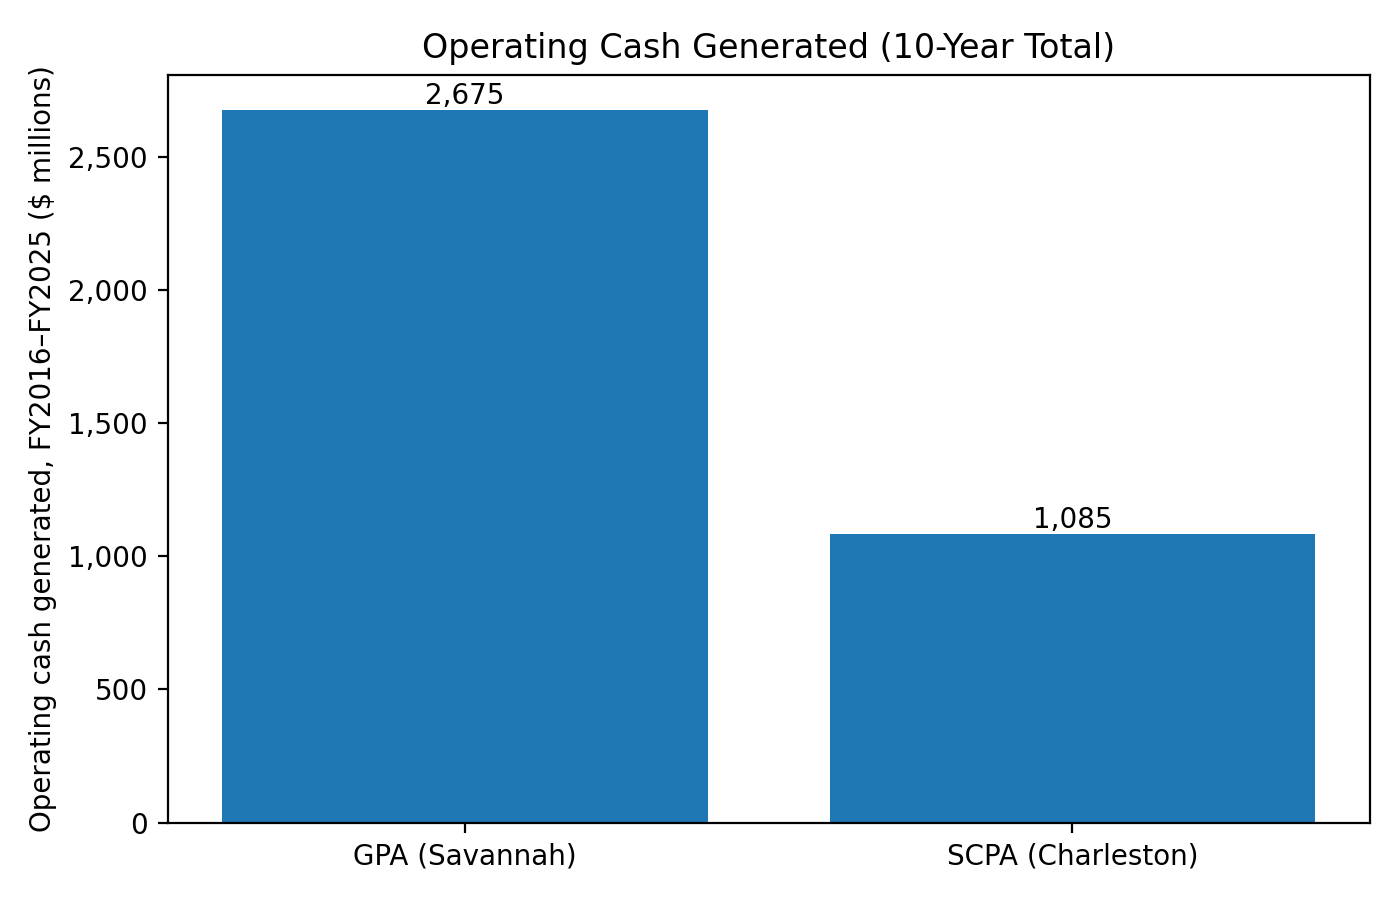
A one-year snapshot makes the operating-cash point concrete: in FY 2025, Savannah and Charleston carried broadly comparable debt loads, but Savannah generated materially more cash from operations while Charleston also received substantial direct state support.
| FY 2025 snapshot | Georgia Ports Authority (Savannah) | South Carolina Ports Authority (Charleston) |
|---|---|---|
| Net cash provided by operating activities | $355,217 ($000s) | $125,420 ($000s) |
| Total debt (bonds payable) | $1,278,143 ($000s) | $986,110 ($000s) |
| Container volume | ~5.70 million TEUs | 2,566,764 TEUs |
| Direct state support | — | $260,100 ($000s) |
Taken together, the FY 2025 snapshot shows why “operating cash” matters: it is the internal capacity that determines whether expansion can be funded from operations, or whether the balance gets filled through other means.
GPA initiatives funded with internal capital (FY 2025 report highlights)
| Initiative | Funding mix (as described) |
|---|---|
| Brunswick Ro-Ro berth expansion | $85 million internal + $15 million federal |
| Ocean Terminal redevelopment (Savannah) | $840 million internal |
| New U.S. Customs & Border Protection facility (Garden City Terminal) | $45 million internal |
That self-funding capacity is the backdrop for the next section: when internal cash is insufficient, political activity and external funding tend to become more central.
Lobbying Activity: A Clear Inflection Point
Source: South Carolina State Ethics Commission lobbying disclosures (Principal: “Ports Authority, State”). Dollar figures below are total payments & expenditures by calendar year.
| Year | Registered Lobbyists | Total Lobbying Spend (calendar year) |
|---|---|---|
| 2025 | 8 | $110,313 |
| 2024 | 6 | $244,543 |
| 2023 | 7 | $220,188 |
| 2022 | 6 | $267,774 |
| 2021 | 6 | $183,418 |
| 2020 | 2 | $28,562 |
| 2019 | 1 | $26,434 |
| 2018 | 1 | $37,624 |
| 2017 | 1 | $48,213 |
| 2016 | 1 | $16,292 |
| 10-Year Total | — | $1,183,361 |
Direct State Support: When the Switch Flips
| FY | Reported “State Support” ($000s) |
Less: Pass-through ($000s) |
Adjusted State Support ($000s) |
|---|---|---|---|
| 2025 | 260,100 | 0 | 260,100 |
| 2024 | 134,873 | 0 | 134,873 |
| 2023 | 87,258 | 0 | 87,258 |
| 2022 | 13,909 | 0 | 13,909 |
| 2021 | 406 | 0 | 406 |
| 2020 | 11,337 | 0 | 11,337 |
| 2019 | 4,494 | 0 | 4,494 |
| 2018 | 299,318 | 299,318 | 0 |
| 2017 | 2,046 | 0 | 2,046 |
| 2016 | 7,185 | 0 | 7,185 |
| Total | 820,926 | 299,318 | 521,608 |
State of South Carolina Support to SCPA — What the Money Was For
Operating-era support, summarized from audited financial statements and accompanying notes.
| Fiscal Year | Adjusted State Support | What the State Money Paid For (plain English) |
|---|---|---|
| 2025 | $260.1 million | Navy Base Intermodal Facility construction ($149.8M); $50M loan forgiveness for North Charleston terminal-adjacent property; $55M land acquisition; Port Access Road funding; Jasper Ocean Terminal planning; minor Commerce-related grants. |
| 2024 | $134.9 million | Continued NBIF construction funding; terminal and port-related capital support; project continuation and infrastructure costs. |
| 2023 | $87.3 million | Early-phase NBIF funding; harbor- and terminal-related infrastructure; intermodal and rail-preparation activities. |
| 2022 | $13.9 million | Initial rail-related and port infrastructure support associated with planned future expansion. |
These descriptions reflect how the funding is characterized in SCPA’s audited reporting and related disclosures, summarized for readability.
Governance Framing: Appropriations as “Performance”
- SCPA audited financial reports. Investor Relations & Financial Reports
- GPA audited financial reports. Investor Relations
- South Carolina Ethics Commission. Lobbying Activity disclosures (Principal: “Ports Authority, State”).
- SCPA CEO evaluation (LG-5). Performance Evaluation